There are times when you will have issues with your server connectivity or your websites will have slower page loading speQeds. To check what is going on, you can have a peek at the Daily Process Log to find and troubleshoot the problem.
1. Log in to the WHM panel with your root account.
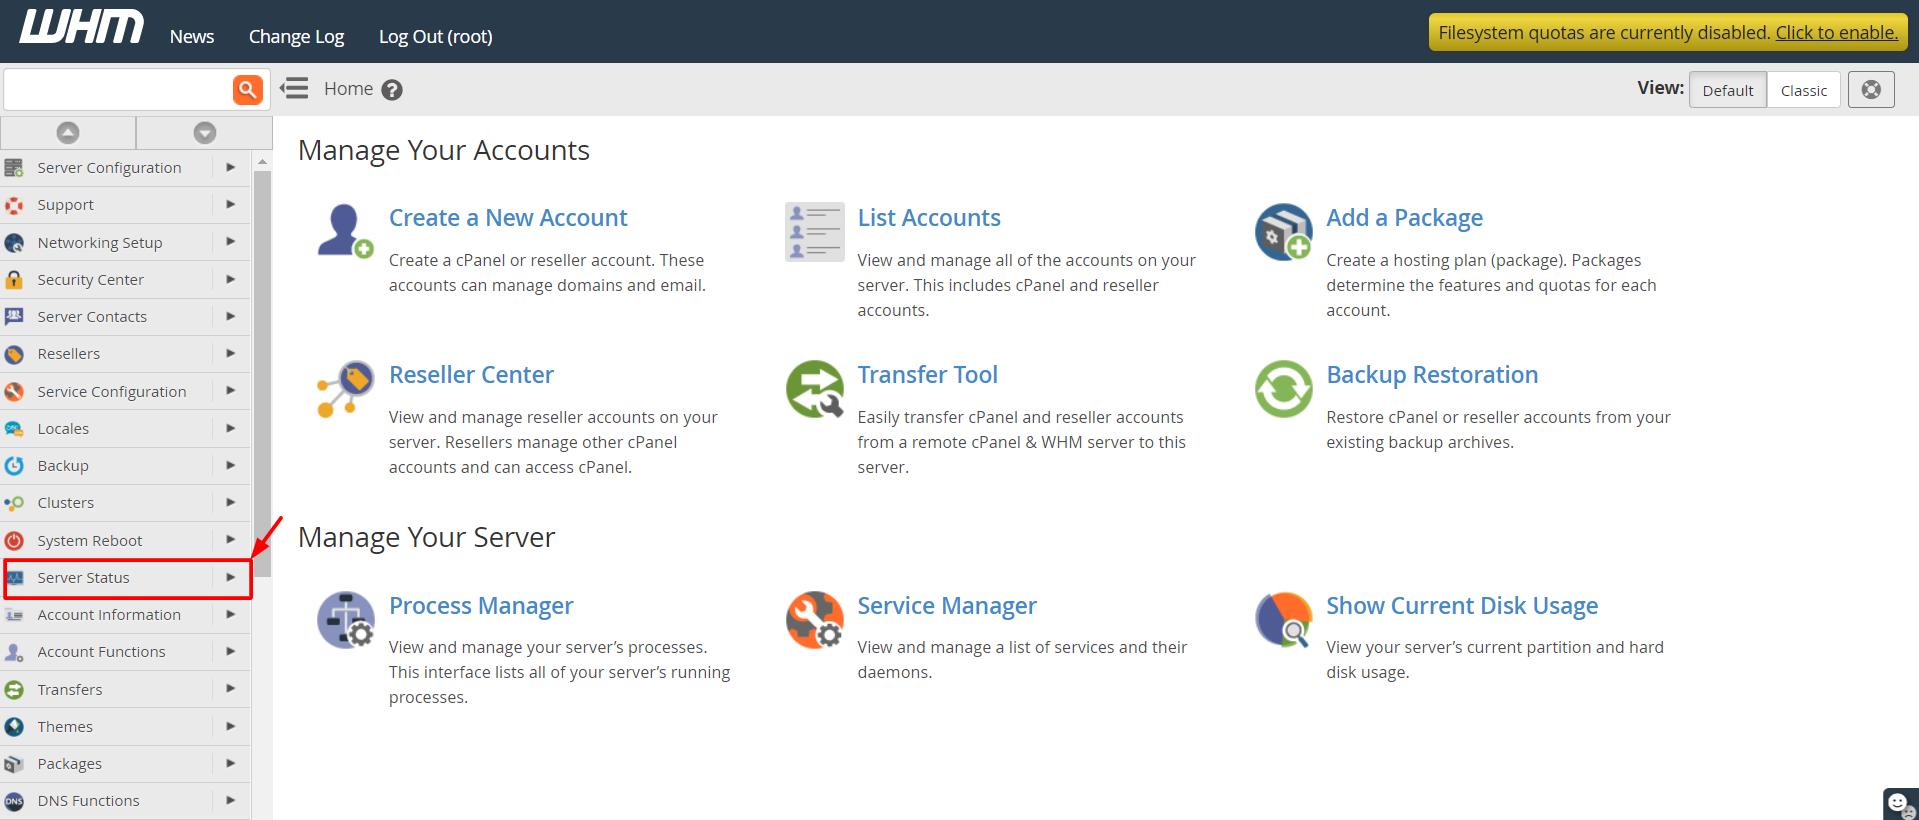
2. Select Server Status from the navigation menu.

3. Click on Daily Process Log.

You can review the logs for the running processes of any day by selecting the dates as shown in the below screenshot.

The log will contain two tables.
The first table will display the percentage of CPU and memory storage of your website(s). Additionally, the last column will contain the average number of MySQL processes for every user.
The second table, Top Processes, will contain a list of processes that the server has deployed for each user. It shows the percentage of CPU usage and the process name.
With the Daily Process Log, you can check for any irregularities in the processes and contact support to check it for you.


